Most employees do not quit when they first become unhappy. They disengage quietly first. Productivity drops, trust fades, and by the time leadership notices, retention is already at risk.
According to Gallup’s State of the Global Workplace 2025 report, global employee engagement fell to 21% in 2024, costing the world economy an estimated $438 billion in lost productivity.
That is why an employee satisfaction survey is more than an HR checkbox. It helps uncover burnout, communication gaps, management issues, and culture problems before they become expensive turnover problems.
I learned this after running a survey filled with “everything is fine” responses while morale was actually declining behind the scenes. The issue was not the survey tool. Employees simply did not trust the process enough to answer honestly.
In this guide, I will show you what questions to ask, how to run surveys employees trust, how to measure results using ESI and eNPS, and how to turn feedback into visible action that improves engagement and retention.
What Is an Employee Satisfaction Survey?
Here is why this matters for your team right now:
- Retention signal: Satisfaction surveys flag early warning signs of disengagement before employees start looking elsewhere.
- Manager accountability: Results segmented by team reveal where leadership support is falling short.
- Culture barometer: Over time, trend data shows whether your culture is actually improving or just being maintained on paper.
- Informed decision-making: People ops teams get the evidence they need to pitch investments in benefits, tools, or programs to leadership.
- Participation in change: Employees who feel heard are significantly more likely to stay, and more likely to contribute meaningfully.
5 Types of Employee Satisfaction Surveys
Not every survey fits every situation. Here are the formats I reach for depending on what I am trying to learn.
1. Annual Satisfaction Survey
The most comprehensive format for a workplace satisfaction survey. You cover all major dimensions: satisfaction, engagement, management, compensation, growth, and culture. This one sets the strategic direction for your people programs for the year.
| Purpose Measure long-term employee satisfaction, engagement, workplace experience, and retention risk using benchmark metrics like ESI and eNPS. Response Scale Section 1: Employee Satisfaction Index (ESI) Question Section 2: Workplace Satisfaction Section 3: Employee Net Promoter Score (eNPS) Section 4: Key Drivers of Satisfaction Section 5: Open Feedback |
Best for: Annual planning cycles, budget requests, culture audits.
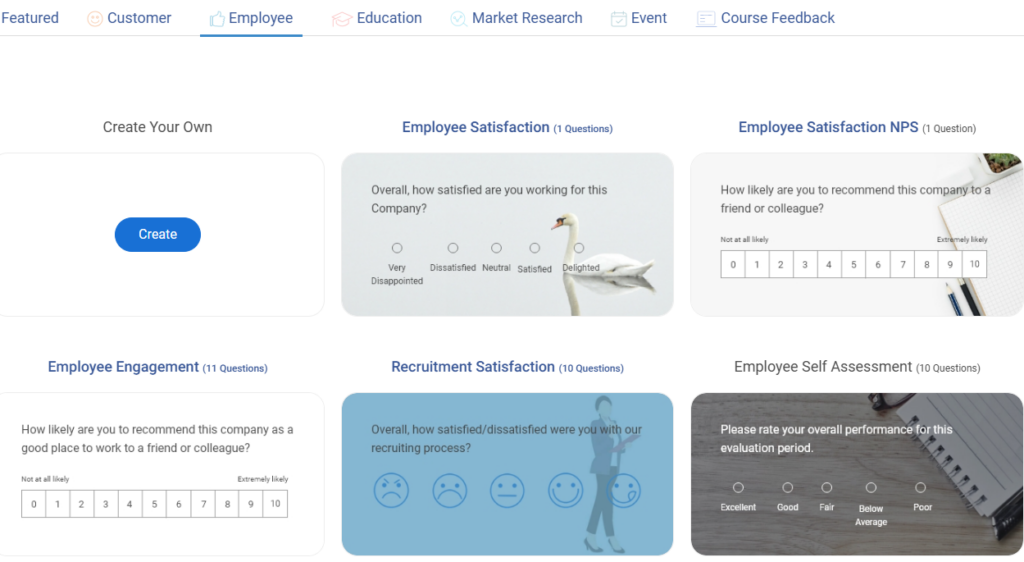
Here’s a pre-made/readymade employee satisfaction survey template for your ease.
2. Pulse Survey
A short, frequent check-in, typically 5 to 10 questions, sent monthly or quarterly. I use these pulse surveys as a lightweight workplace satisfaction survey approach to track whether issues identified earlier are actually improving.
| Pulse Employee Satisfaction Survey
Purpose Instructions Section 1: Quarterly Employee Satisfaction Index (Mini ESI) Section 2: Pulse Satisfaction Tracking Section 3: Quarterly eNPS Section 4: Burnout & Sentiment How would you describe your current work experience? Section 5: Open Feedback |
Best for: Monitoring progress on specific initiatives, staying ahead of emerging issues. If you want to explore the right tools for this, this roundup of employee pulse survey tools is a solid starting point.
Here’s a pre-made/readymade pulse survey template for your ease.
3. Onboarding Survey
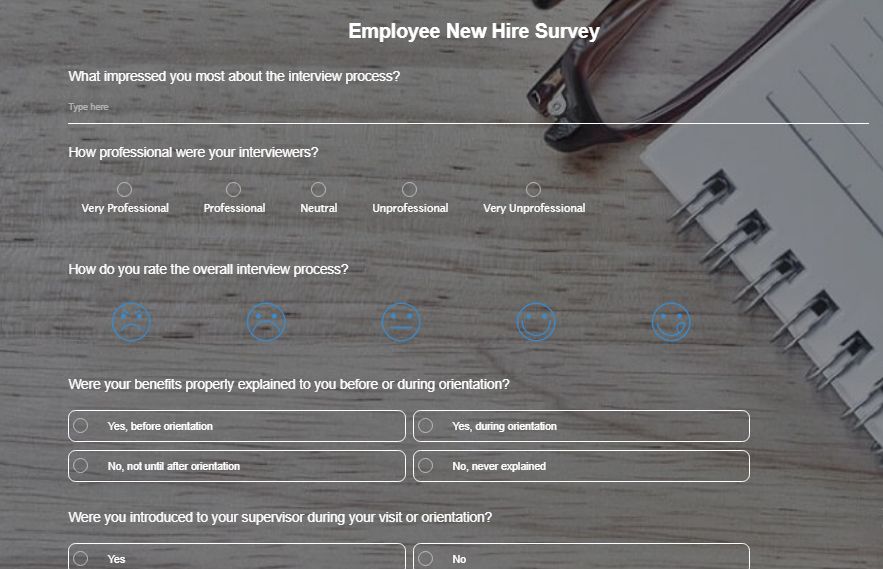
Sent within the first 30, 60, and 90 days. This onboarding survey tells you whether new hires feel supported and whether their experience matches what was promised in the interview process.
| Onboarding Survey Template Purpose Measure the effectiveness of the employee onboarding experience. Multiple Choice Questions Which onboarding resource helped you the most? Rating Scale |
Best for: Catching early attrition risk, improving the onboarding process.
Here’s a pre-made/readymade onboarding survey template for your ease.
4. Exit Survey
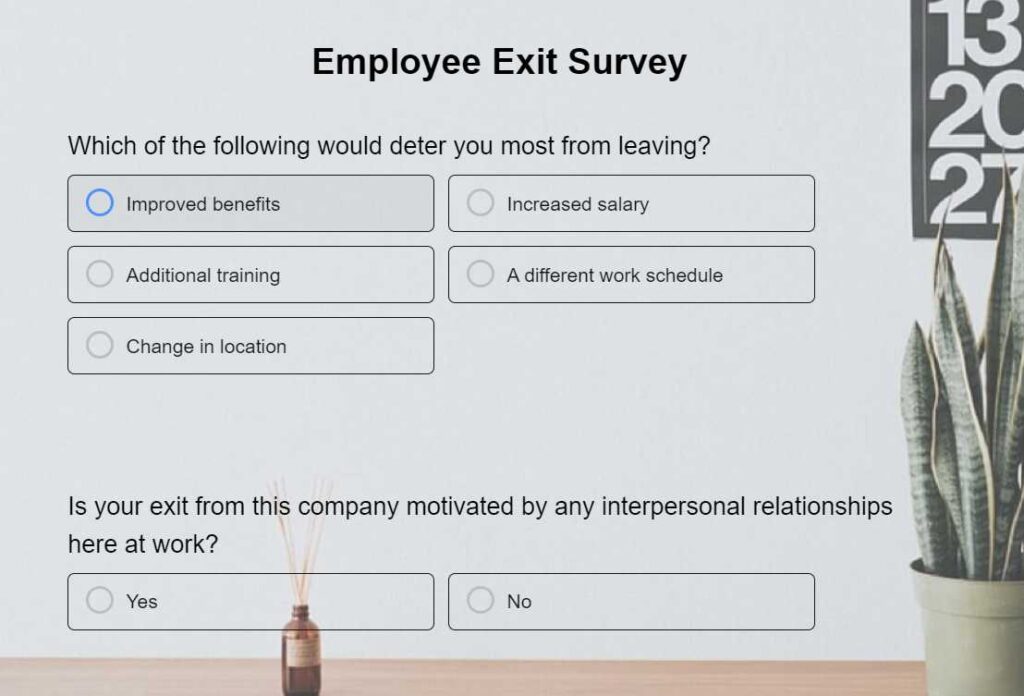
Sent when someone resigns. An exit survey often becomes the most honest company satisfaction survey because employees usually feel safer sharing unfiltered feedback while leaving. The data is often uncomfortable, which is exactly why it is valuable.
| Exit Survey Template
Purpose Multiple Choice What is your primary reason for leaving? Would you consider returning to the company in the future? Agreement Statements Long-Form Feedback |
Best for: Identifying patterns in why people leave, fixing systemic issues.
Here’s a pre-made/readymade exit survey template for your ease.
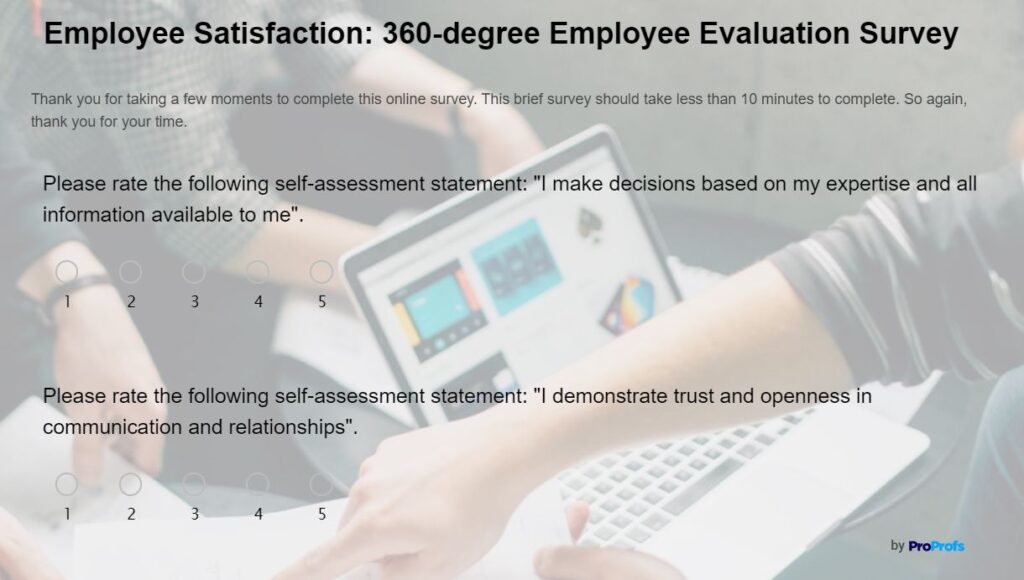
5. 360-Degree Feedback Survey
Goes beyond satisfaction and into performance-linked feedback from peers, direct reports, and managers. If you are specifically looking for tools to run these, this guide on 360-degree feedback tools covers the best options available.
| 360-Degree Feedback Survey Template
Purpose Competency Ratings Competency: Outstanding Good Needs Improvement Communication Behavioral Questions How effectively does this employee support team members? Written Feedback What is one area where this employee can improve? |
Best for: Leadership development, performance review cycles.
Here’s a pre-made/readymade 360-degree feedback template for your ease.
Employee Satisfaction Survey Questions
The best employee satisfaction surveys do not just measure happiness. They uncover why employees stay, disengage, burn out, or consider leaving. These employee feedback survey questions are designed to surface actionable insights across the areas that most directly impact retention and performance.
Here are the categories that consistently surface the most useful insights, along with sample questions you can adapt immediately.
Work Environment & Productivity
| Question | Why It Works |
| Do you feel your work environment helps you stay productive? | Identifies whether employees have the resources, tools, and conditions needed to perform effectively. |
| How often do workplace processes slow you down? | Reveals operational bottlenecks that reduce efficiency and create frustration. |
| Do you have enough uninterrupted time to focus on meaningful work? | Highlights productivity challenges caused by excessive meetings, interruptions, or workload issues. |
| What part of your workday feels most frustrating right now? | Surfaces specific pain points that may not appear in structured survey responses. |
| Do you feel meetings at this company are productive and necessary? | Helps assess whether employees see meetings as valuable or as a drain on productivity. |
| What is the biggest obstacle preventing you from doing your best work? | Pinpoints the most significant barriers affecting employee performance. |
Leadership Trust & Transparency
| Question | Why It Works |
| Do you trust leadership to make decisions in employees’ best interests? | Measures trust, which strongly influences engagement, morale, and retention. |
| How transparent is leadership about company challenges and changes? | Evaluates whether employees feel informed and included during organizational changes. |
| Do leaders follow through on promises and commitments? | Assesses leadership credibility and consistency. |
| How confident are you in the company’s direction over the next year? | Reveals employee confidence in the organization’s future and strategic leadership. |
| What is one thing leadership could communicate more clearly? | Provides actionable feedback on communication gaps. |
Recognition & Motivation
| Question | Why It Works |
| Do you feel motivated to give your best effort at work? | Measures overall engagement and enthusiasm for work. |
| How often do you feel appreciated for your contributions? | Identifies whether recognition is occurring frequently enough. |
| Is good work recognized fairly across teams? | Highlights potential concerns around favoritism or inconsistent recognition practices. |
| What type of recognition matters most to you? | Helps organizations tailor recognition programs to employee preferences. |
| When was the last time you felt genuinely valued at work? | Reveals whether appreciation feels authentic and meaningful. |
Team Collaboration
| Question | Why It Works |
| Does your team collaborate effectively to solve problems? | Assesses teamwork and the effectiveness of cross-functional cooperation. |
| Do you feel supported by your coworkers when challenges arise? | Measures the strength of peer relationships and support systems. |
| Are responsibilities clearly defined within your team? | Identifies role ambiguity that can cause conflict and inefficiency. |
| How comfortable are you asking teammates for help? | Evaluates psychological safety within the team. |
| What could improve collaboration within your team? | Generates practical suggestions for improving teamwork. |
Remote & Hybrid Work Experience
| Question | Why It Works |
| Do you feel connected to your team while working remotely or hybrid? | Measures belonging and team cohesion among distributed employees. |
| Does the company provide enough support for remote work success? | Evaluates whether employees have the tools and resources needed to work effectively. |
| Are communication tools helping or hurting collaboration? | Identifies technology-related barriers to teamwork. |
| Do you feel included in decisions regardless of your work location? | Assesses fairness and inclusion across remote and in-office employees. |
| What would improve your remote or hybrid work experience? | Collects actionable feedback on remote work challenges and opportunities. |
Employee Well-Being & Burnout
| Question | Why It Works |
| How often do you feel emotionally drained after work? | Provides an early indicator of burnout risk. |
| Do you feel encouraged to take time off when needed? | Assesses whether employees feel supported in maintaining work-life balance. |
| Is workplace stress manageable most of the time? | Helps gauge overall workload sustainability. |
| Do you feel the company genuinely cares about employee well-being? | Measures employee perceptions of organizational support. |
| What contributes most to stress in your role? | Identifies the root causes of stress and burnout. |
Company Culture & Belonging
| Question | Why It Works |
| Do you feel a sense of belonging at this company? | Measures inclusion and emotional connection to the organization. |
| Does the company culture encourage openness and honesty? | Evaluates psychological safety and communication culture. |
| Do you feel respected regardless of your role or background? | Assesses fairness, respect, and inclusivity. |
| How well do company values align with everyday workplace behavior? | Reveals gaps between stated values and actual employee experiences. |
| What part of the company culture would you change first? | Identifies cultural issues that matter most to employees. |
Retention & Commitment
| Question | Why It Works |
| Do you see yourself working here a year from now? | Serves as an early indicator of retention risk. |
| Have you considered leaving the company in the past six months? | Helps identify turnover concerns before employees resign. |
| What factors make you stay at this company? | Reveals the organization’s strongest retention drivers. |
| What might cause you to look for another opportunity? | Identifies potential risks that could increase employee turnover. |
| What is one thing the company could do to improve employee retention? | Provides direct, actionable ideas for reducing attrition. |
Open-Ended Insight Questions
| Question | Why It Works |
| What is something the company is doing well that should continue? | Highlights strengths employees value and want preserved. |
| What is one policy or process you would improve immediately? | Uncovers opportunities for quick organizational improvements. |
| If you could change one thing about your work experience, what would it be? | Helps prioritize the issues that matter most to employees. |
| What would make this company a better place to work? | Encourages broader suggestions that may not fit predefined categories. |
| Is there anything else you wish leadership understood about employee experience? | Gives employees space to raise concerns or insights not covered elsewhere. |
3 Best Employee Satisfaction Survey Tools
To run the survey types and questions above, you need a platform that handles anonymity, reporting, and distribution reliably. These are the tools I use and recommend.
1. ProProfs Survey Maker – Best for Comprehensive Employee Satisfaction Surveys
As a long-time user of ProProfs Survey Maker, I can confidently say it is one of the easiest employee survey tools for running structured employee satisfaction surveys at scale. It comes with customizable templates for pulse surveys, eNPS tracking, onboarding feedback, employee engagement surveys, and anonymous employee feedback survey workflows.
What I found especially useful is how quickly I could launch surveys using the AI survey builder and then analyze open-ended employee feedback using built-in reporting and text analytics. You can try it out here:
Describe your survey and we'll create it for you
Features like branching, skip logic, scoring, and mobile-friendly surveys also helped improve participation rates and response quality. It also works well for teams looking for lightweight employee pulse survey tools and structured 360 feedback tools within the same ecosystem.
Pros:
- AI-powered survey creation for faster setup
- Supports pulse surveys, eNPS, onboarding, and employee engagement surveys
- Anonymous feedback collection with customizable survey logic
- Real-time analytics and easy-to-read reports for HR teams
- Integrates with CRM and business tools for centralized reporting
Cons:
- Some advanced customization options may take time to fully explore
- Lower-tier plans have admin limitations
Pricing:
Free plan for up to 50 responses. Paid plans start at $19.99/month.
2. Trakstar – Best for Employee Engagement Analytics
Trakstar is a strong option for HR teams that want deeper employee engagement tracking alongside satisfaction surveys. I liked how the platform connects survey insights with performance reviews, employee check-ins, and engagement trends to give a broader picture of workplace health.
Its analytics dashboard makes it easier to identify patterns around burnout, manager effectiveness, and employee sentiment over time. The reporting is visually polished, which is especially helpful when presenting findings to leadership teams.
Pros:
- Advanced employee engagement and pulse survey analytics
- Helps track engagement scores and response trends
- Combines survey data with performance management insights
- Well-designed reports for leadership presentations
Cons:
- Limited integrations compared to some competitors
- Survey customization options could be more flexible
Pricing:
Custom pricing available on request.
3. Workleap (Formerly Officevibe) – Best for Employee Experience Management
Workleap focuses heavily on employee experience and continuous feedback. I found it particularly useful for running recurring pulse surveys, anonymous feedback collection, and eNPS tracking across remote or hybrid teams.
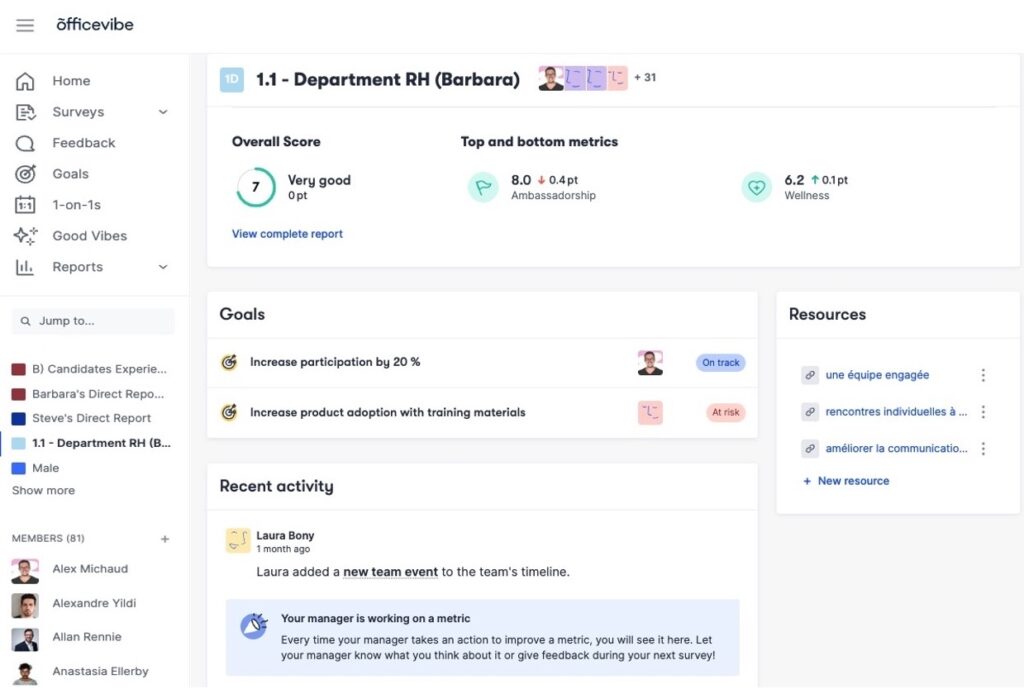
The employee recognition and manager support features also stood out because they encourage ongoing engagement instead of treating surveys like a once-a-year exercise. The platform works well for organizations trying to build a stronger feedback culture over time.
Pros:
- Excellent pulse survey and employee feedback tools
- Built-in eNPS tracking and recognition features
- Supports remote and hybrid workforce management
- Integrates with Slack, Microsoft Teams, and Google Workspace
Cons:
- Limited survey creation flexibility
- Some survey questions cannot be fully customized
Pricing:
Free plan available. Paid plans start at $5/user/month.
FREE. All Features. FOREVER!
Try our Forever FREE account with all premium features!
How to Create an Employee Satisfaction Survey
Employee satisfaction surveys help organizations understand how employees feel about their work experience, leadership, workplace culture, growth opportunities, and overall job satisfaction. They uncover what is working well, identify areas for improvement, and provide actionable insights to boost engagement, retention, and performance.
Today, I’ll show you the full process, from logging in to analyzing responses, using ProProfs Survey Maker, which offers ready-made employee satisfaction survey templates, AI-powered survey creation and refinement, customizable question types, and built-in reporting and analytics.
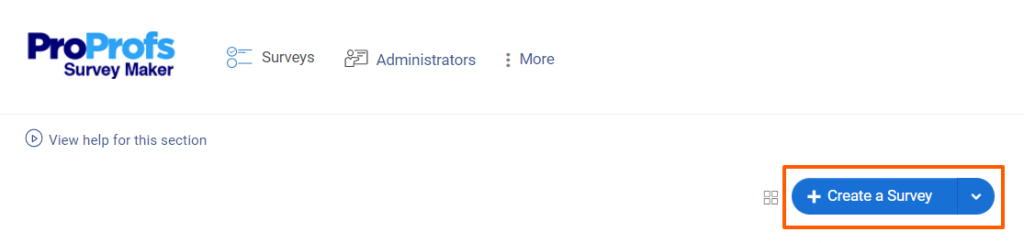
Step 1: Log In and Start an Employee Satisfaction Survey
From the dashboard, click + Create a Survey.
Look for and click an Employee Satisfaction Survey template (or browse employee feedback and engagement survey templates under relevant categories).
If you prefer a blank start or AI-generated questions, you can skip templates and proceed directly to adding questions via AI.
Start from scratch or open a blank survey.Click Add Question → Generate with ProProfs AI.
In the overlay:
- Topic (max 100 chars): e.g., “Employee satisfaction survey.”
- Description (max 200 chars): e.g., “Create questions that measure employee satisfaction, workplace culture, leadership, recognition, collaboration, work-life balance, and overall engagement. Include a mix of rating-scale and open-ended questions. Clear, neutral, professional.”
- Select question types (e.g., Rating Scale, Multiple Choice, Text Box) and the desired number of questions.
- Click Generate with ProProfs AI.
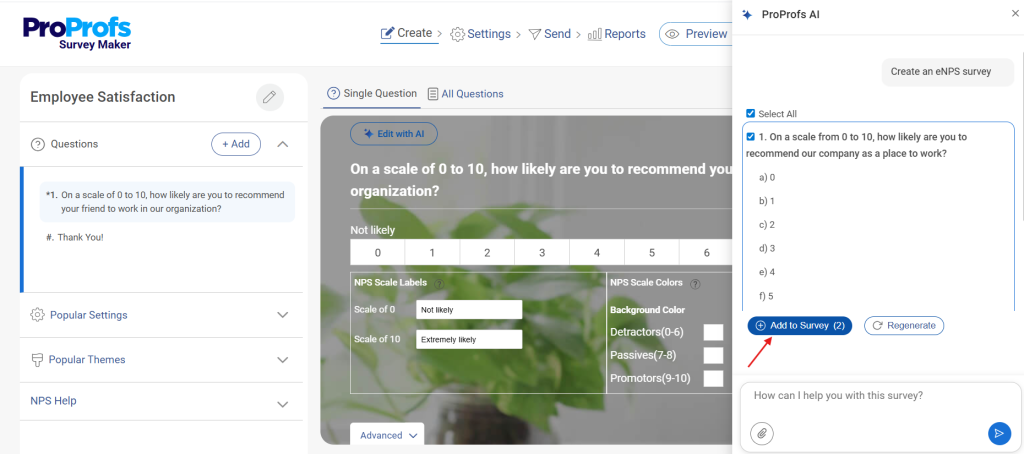
Step 2: Edit and Customize the Survey Questions with AI
Customize questions to focus on the areas most relevant to your organization, such as:
- Work environment and productivity
- Leadership and communication
- Recognition and motivation
- Team collaboration
- Employee well-being
- Company culture
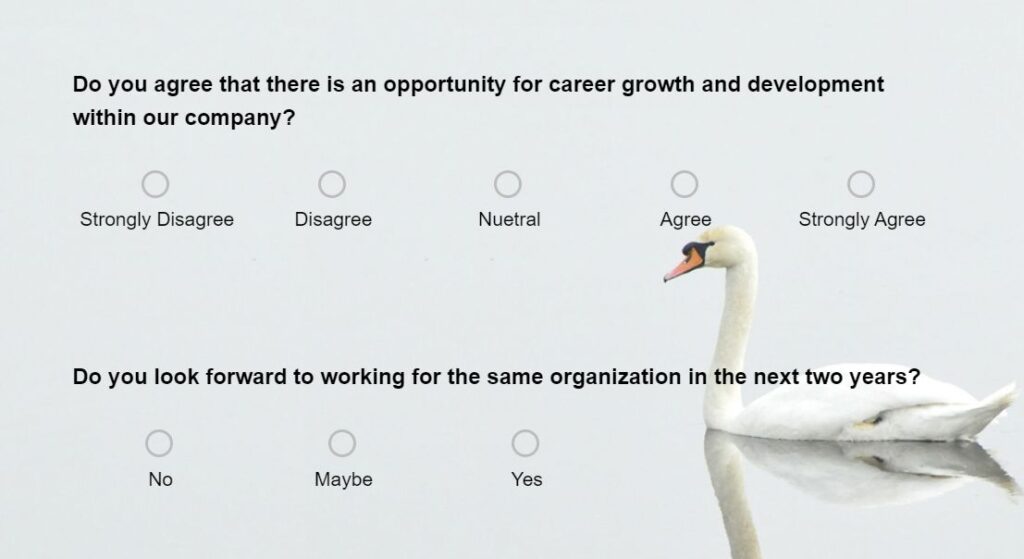
- Career growth and development
Refine any question with Edit with AI (select question → Edit with AI → enter a prompt such as “Make this more engaging and concise” → Regenerate → Replace).
Add open-ended questions to gather deeper employee feedback and suggestions.
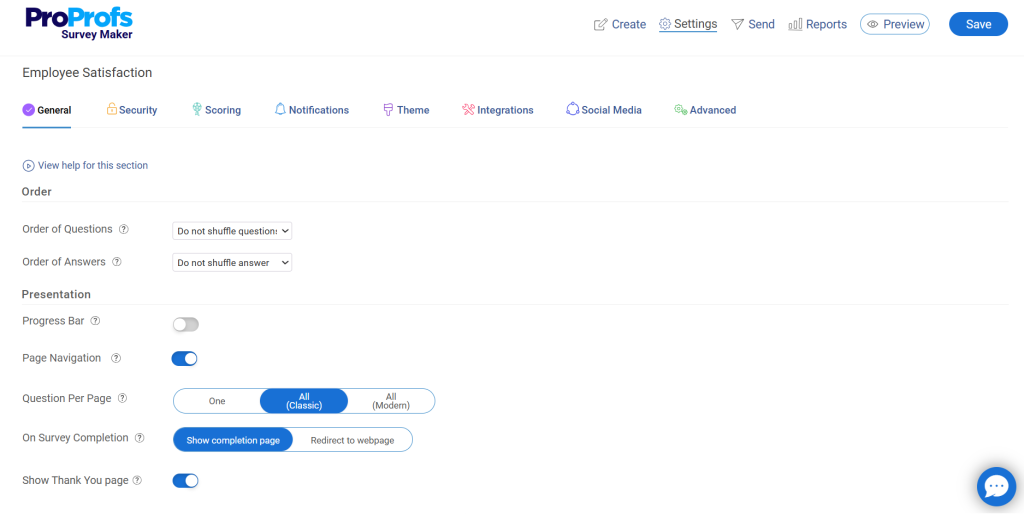
Step 3: Set Up Survey Settings and Deployment
Go to Settings:
- Enable anonymity from Security if you want employees to provide candid feedback.
- Add branding (logo, colors) via the Theme tab.
- Set a progress bar, shuffle questions/answers, or limit responses if needed.
- Configure the completion page with a custom thank-you message or redirect URL.
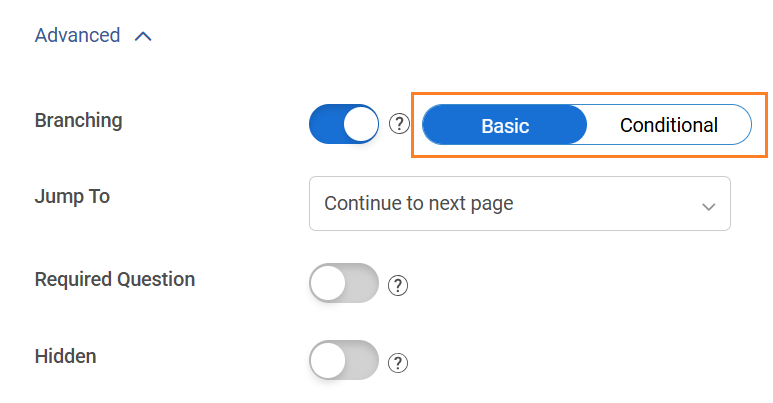
Add skip logic or branching if you want employees to see follow-up questions based on their responses.
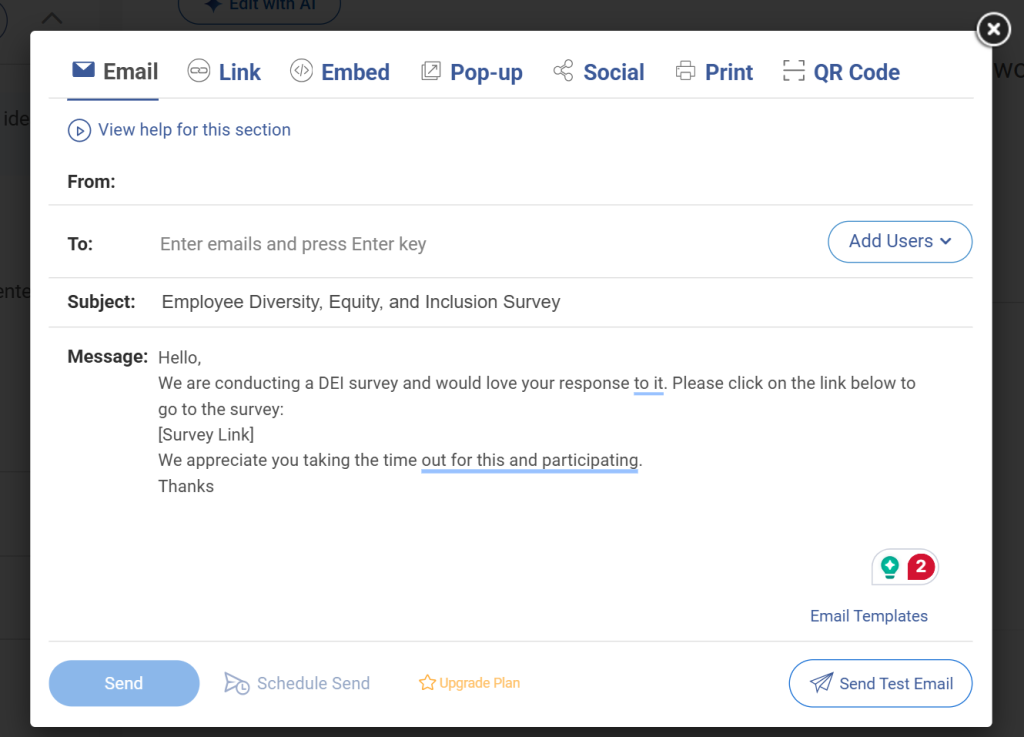
For distribution:
- Use the Publish/Share tab to get an embed code, survey link, popup, email invitation, or social sharing options.
- Share the survey through internal email campaigns, employee newsletters, HR portals, intranets, or team communication channels.
- Schedule invitations or define survey availability dates if needed.
Step 4: Publish, Collect, and Analyze Responses
Monitor responses through the Reports dashboard.
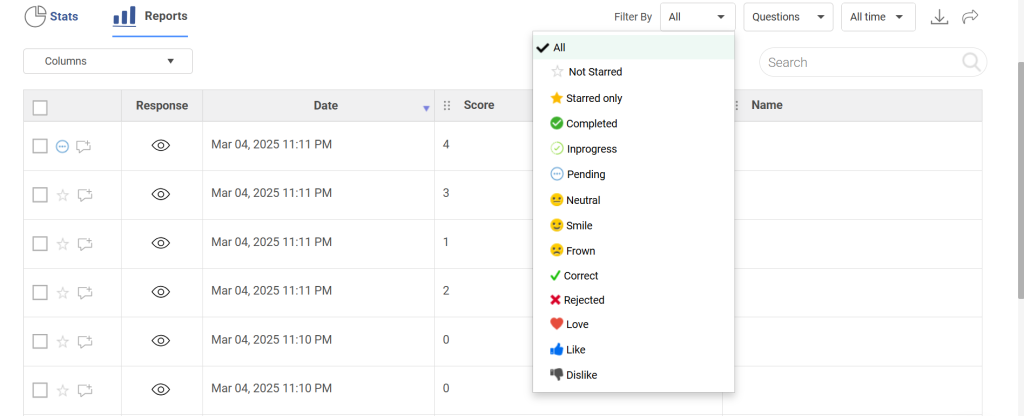
View:
- Response summaries
- Charts and visual reports
- Individual responses
- Trends across satisfaction areas
Analyze feedback to identify strengths, recurring concerns, and opportunities for improvement. Look for patterns in areas such as leadership, recognition, workload, communication, and employee well-being. Use the insights to prioritize workplace improvements, communicate action plans, and measure progress through future surveys.
ProProfs Survey Maker simplifies employee satisfaction surveys with ready-made templates, AI-powered survey creation, customizable questions, and real-time analytics. Sign up for free and create your employee satisfaction survey today.
If you prefer visual guidance, there’s also a short tutorial video in the dashboard that walks through creating a questionnaire from scratch, from choosing templates to publishing and viewing responses:
How to Analyze Employee Survey Results Without Getting Overwhelmed
Once responses come in, the instinct is to look at everything at once. Resist that. Here is the process I use to go from raw data to a clear action plan.
Step 1: Check Your Response Rate First
Your response rate is the first finding, not a footnote. If participation is low, the sentiment data you have is skewed – you’re hearing from the most engaged and the most disgruntled, with the silent majority missing entirely.
| Response Rate | What It Actually Means | What to Do First |
| 70%+ | Employees trusted the process enough to participate | Proceed to analysis |
| 50-70% | Passive skepticism – not opposed, just not invested | Note which teams came in low; factor into your read of the data |
| Below 50% | A trust problem, not a design problem | Address process credibility before acting on sentiment scores |
One more thing to check before you move on: where did non-responses cluster? A department sitting at 28% when your company average is 65% is telling you something. Teams with the lowest participation often have the most significant issues – they’ve learned through experience that filling out surveys doesn’t change anything.
Step 2: Segment Before You Read a Single Score
A company-wide satisfaction average is almost always the least useful number in your results. It flattens the gaps that actually matter.
Before you read a single score, run your data three ways:
| Segment | What to Look For | What It Usually Means |
| By team or department | One team significantly below the company average | A local problem – manager, workload, or team dynamic – not a company-wide one |
| By manager | Same low score appearing across multiple teams under one person | The fix is specific and the conversation needs to happen at the manager level |
| By tenure band | New hires scoring lower than tenured employees | An onboarding or expectation gap – the job isn’t matching what was promised at hire |
| By tenure band | 18-36 month employees scoring lower on growth and recognition | A retention risk window – this is typically when people start looking |
The practical upside of segmenting first is that your action plan becomes specific. “Improve manager communication” is not an action. “Three teams under two managers scored 2.1 on leadership transparency against a company average of 3.8” is something you can do something about.
Step 3: Track Direction, Not Just the Number
A score of 3.2 on “my workload feels manageable” is almost meaningless without knowing whether it was 3.6 last quarter or 2.9. You are not chasing a perfect score – you are tracking movement.
Here is how to read trend data:
- Declining for two consecutive cycles – treat as urgent regardless of the absolute score. Consistent decline means either the problem is getting worse or it wasn’t addressed after the last survey, both of which need immediate attention.
- One-time low that didn’t appear before – flag it and watch next cycle before building a full initiative around it.
- Improving but still below average – your current intervention is working. Stay the course rather than changing approach mid-cycle.
- Stable and low for multiple cycles – this has become normalized. Employees have stopped expecting it to change, which is a different and more serious problem than a new low.
If this is your first survey, you don’t have trend data yet. That’s fine – your job this cycle is to establish baselines carefully and note which three to five items you’ll watch most closely next time. The value of this data compounds over time.
Step 4: Find the Why in Open-Text Responses
Scores show what is broken. Comments tell you why – and this is the step most teams either skip entirely or get lost in. The goal is not to read every response individually. It is to find the patterns that scores alone cannot show you.
| Action | How to Do It |
| Read first, categorize second | Go through all responses once without sorting. You’re looking for repeated language, not individual opinions |
| Sort into themes | Workload, manager behavior, communication, tools, career growth, recognition, culture |
| Count per theme | The theme with the most responses is your strongest signal |
| Watch the exact language | “Employees feel underrecognized” is easy to dismiss. “14 responses used the word invisible independently” is not |
| Watch what’s absent too | If no one mentioned a major reorg, either people don’t feel safe raising it – or it genuinely isn’t what’s bothering them |
If your platform has text analytics, use it to surface keyword clusters before you start sorting manually. It won’t replace reading the responses yourself, but it will show you the full shape of the feedback before you start theming.
Step 5: Pick Three Priorities, Not Twenty
After analysis, the instinct is to build a 20-point action plan. Resist it. A long list of priorities means nothing gets owned, nothing gets fixed, and participation drops in your next survey because employees have seen this before.
| Criteria | What to Ask |
| Affects the most people | Is this concentrated in one team or widespread across the company? |
| Links to a measurable outcome | Does this connect to retention, productivity, or engagement – not just sentiment? |
| Fixable within 90 days | Is this realistic given your current resources and access? |
Issues that don’t make the top three don’t disappear – log them as tracked items and tell employees explicitly: “We heard this, it didn’t make the top three this quarter, and we will revisit it in Q3.” That one line does more for participation in your next survey than almost anything else you can do.
Employee Satisfaction vs. Employee Engagement vs. eNPS
Before you build your survey, you need to be clear on what you are actually measuring. I have seen teams collapse all three into one survey and end up with data that explains nothing.
Satisfaction tells you whether employees feel their basic needs are being met: fair pay, safe working conditions, manageable workload, and reasonable management. It is about contentment.
Engagement tells you whether employees are motivated to put in discretionary effort. A satisfied employee might show up and do their job. An engaged employee cares about the outcome and goes beyond what is required.
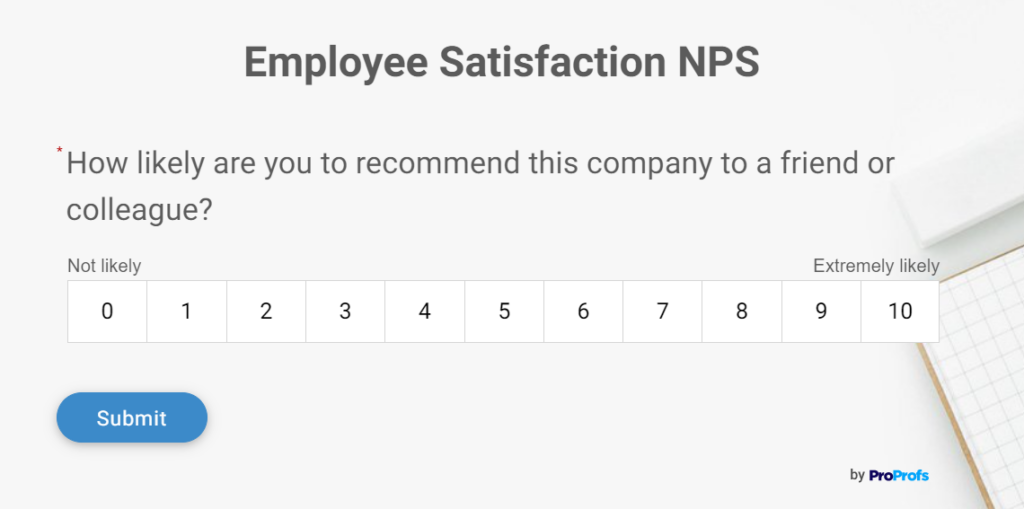
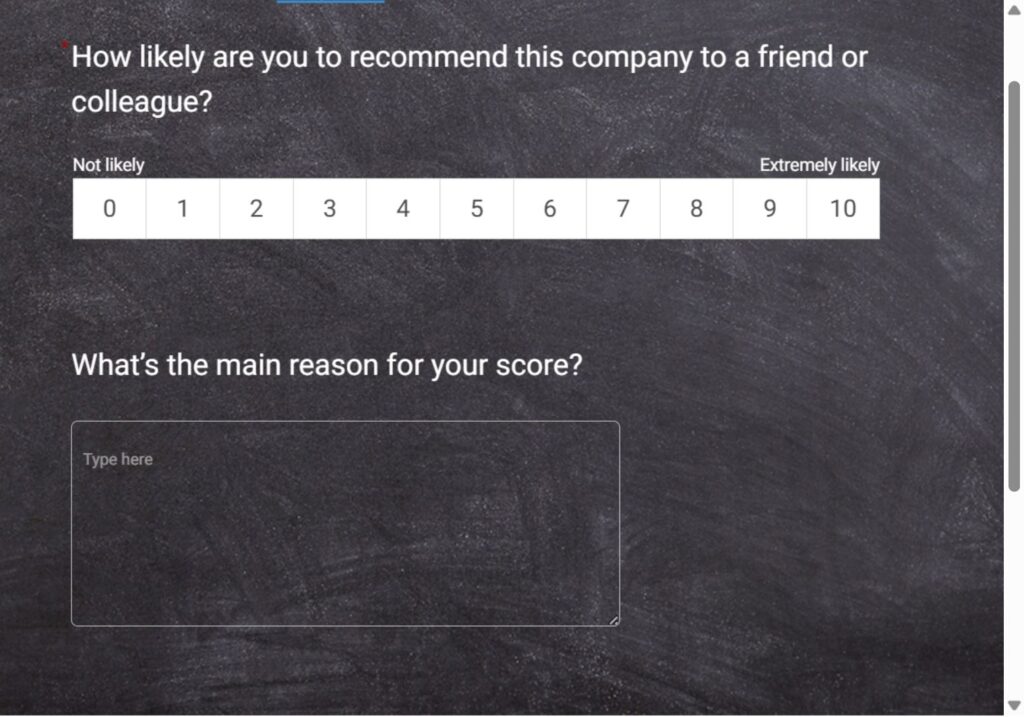
eNPS (Employee Net Promoter Score) is a single question: “On a scale of 0 to 10, how likely are you to recommend this company as a place to work?” It gives you a fast loyalty metric you can track every quarter.
You need all three, but you measure them at different frequencies and act on them differently. Most teams run one deep satisfaction survey annually, with quarterly eNPS or pulse surveys to stay current.
What Are The Metrics Worth Tracking?
If your leadership team wants a number they can track over time, these two formulas are the most practical ones I have used.
1. Employee Satisfaction Index (ESI)
The ESI uses three core questions, each rated on a scale of 1 to 10:
- How satisfied are you with your current workplace?
- How well does your workplace meet your expectations?
- How close is your workplace to the ideal one?
ESI formula: ((Mean value of all 3 questions / 3) / 10) x 100
A score above 70 is generally considered healthy. Below 50 is a red flag.
2. eNPS (Employee Net Promoter Score)
Single question: “On a scale of 0 to 10, how likely are you to recommend this company as a place to work?”
- Scores of 9 to 10: Promoters
- Scores of 7 to 8: Passives
- Scores of 0 to 6: Detractors
eNPS formula: % Promoters minus % Detractors
Scores above +20 are good. Above +50 is excellent. Negative scores mean you have a serious retention risk.
Run eNPS quarterly. It takes 30 seconds to answer, and the trend line over four quarters tells you more than any deep survey.
FREE. All Features. FOREVER!
Try our Forever FREE account with all premium features!
How to Turn Survey Results Into Action People Can Actually See
This is the part where most companies fall short. They collect data, share a report, and then move on. Employees notice. And next time you run a survey, fewer people fill it out.
1. Share What You Found Within Two Weeks
Speed signals that you take the feedback seriously. A short message to the whole company: “Here is what we heard. Here are the three things we are prioritizing. Here is who owns each one.” That is all you need.
2. Assign a Named Owner to Each Priority
A priority without an owner is a wish. Pick someone with the authority and the bandwidth to move it forward, and make their name part of the communication. Accountability is visibility.
3. Write a One-Page Action Plan
You do not need a 40-slide deck. One page: the problem, the two or three moves you will make, the timeline, and the owner. Share it in a team meeting and post it somewhere people can reference it.
4. Report Progress Every Month
A short monthly update: what moved, what stalled, what is next. This turns a survey into an ongoing feedback loop rather than a one-time event. It is also the single best way to increase participation in your next survey.
5. Close the Loop With the Team
Once a change has been made, connect it explicitly back to the survey. “You told us our onboarding process felt unclear. We rebuilt the first 30 days. Here is what is different.” This kind of visible follow-through is what builds the psychological safety that makes future surveys worth running.
How Often Should You Survey Employees?
This is one of the most common questions I get from HR teams, and the honest answer is: it depends on how fast you can act on the feedback.
- Annual survey: Deep, comprehensive, covers all dimensions. Best for strategic planning.
- Quarterly pulse: 5 to 10 questions, focused on a single theme. Best for tracking progress on specific issues.
- Monthly micro-survey: One or two questions embedded in tools employees already use. Best for fast sentiment signals and catching problems before they compound.
A practical starting point for most teams: one annual survey plus quarterly eNPS. Once you have built the feedback loop and people trust the process, add a monthly pulse for the topics that matter most that quarter.
What you should never do: survey monthly with no visible follow-through. Survey fatigue is real, but the research is clear that the bigger killer of participation is inaction. Employees will fill out surveys 10 times a year if they believe something changes each time.
Common Employee Survey Mistakes (and How to Avoid Them)
I’ve seen even well-designed employee surveys fail when employees do not trust the process or never see action taken afterward.
Over time, I’ve learned that avoiding a few common mistakes can dramatically improve response quality and help turn employee feedback into meaningful workplace improvements.
| Mistake | Why It Happens | What to Do Instead |
| Low response rates | Employees do not trust anonymity or see no point | Reinforce anonymity, explain the plan, shorten the survey, use a QR code for easy access |
| Vague data | Questions are double-barreled or too broad | One idea per question, clear scales, targeted open-text prompts |
| Survey fatigue | Too many long surveys with no follow-through | One deep annual survey, short quarterly pulses, and visible action after every cycle |
| Insights that go nowhere | No owner, no plan, no update | Pick three priorities, assign owners, report progress monthly |
| Skewed data | Only the happiest or unhappiest employees respond | Make it easy to complete, keep it short, communicate that all voices matter |
Turn Employee Feedback Into Real Workplace Improvements
Employee satisfaction surveys and every workplace satisfaction survey only work when employees believe their feedback leads to visible change.
In this guide, we covered how to design surveys people actually trust, the most effective survey types and questions to use, how to measure results using ESI and eNPS, and how to turn feedback into action that improves retention, engagement, and workplace culture over time.
If you want a faster way to put this into practice, ProProfs Survey Maker is a strong option. It helps HR teams create employee feedback surveys quickly with AI-generated templates, anonymous responses, mobile-friendly design, text analytics, and easy-to-read reports that managers can actually act on.
You can start with a pulse survey, track trends quarterly, and build a repeatable feedback loop without adding complexity.
Your next step is simple: launch one focused survey, act on the feedback visibly, and build trust from there.
Frequently Asked Questions
What is the difference between an employee satisfaction survey and an employee engagement survey?
Satisfaction measures whether employees feel their basic needs are met: fair compensation, reasonable workload, safe environment. Engagement measures whether they are motivated to go beyond what is required. Both matter, but they point to different problems and different solutions. You can have a satisfied but disengaged workforce, which is exactly the combination that leads to quiet quitting.
How do I get employees to actually fill out the survey?
The two biggest drivers of participation are anonymity and trust that something will change. Before you launch, tell employees explicitly how their responses are protected and when they will hear back. After the survey, share what you learned and what you are doing about it. Participation in the next survey will be noticeably higher.
What is a good response rate for an employee satisfaction survey?
A response rate above 70% is considered strong. Between 50% and 70% is acceptable but suggests some trust gap. Below 50% is a signal that employees do not believe the process is safe or worth their time. Before you analyze the sentiment data, fix the participation problem.
How long should an employee satisfaction survey be?
Annual deep surveys should have no more than 20 to 30 questions. Pulse surveys should stay between 5 and 10 questions. The goal is a survey someone can complete in under 10 minutes. Longer surveys do not produce better data. They produce more incomplete responses and lower-quality answers on questions toward the end.
Can managers see individual survey responses?
Only if you allow it. On most modern survey platforms, you can configure anonymous reporting so only aggregated results are visible. I strongly recommend doing this and communicating it to employees before the survey launches. Do not share breakdowns from groups smaller than five people, as the data becomes effectively identifiable.
What should I do if the survey results are very negative?
Do not panic, and do not suppress the data. Negative results are useful results. Prioritize the two or three issues that are most widespread and most fixable, assign owners, and communicate a clear plan to the team. Employees who share difficult feedback and then see action taken are your most engaged employees going forward. The ones who never get a response are the ones who stop participating.
FREE. All Features. FOREVER!
Try our Forever FREE account with all premium features!
 We'd love your feedback!
What did you like & how can we make it even better?

 Thanks for your feedback!
 Ask Your Question
Have a question? Get expert help to make your decision easier.